Marathon Analysis in 10 Charts
In both my work and private life I'm a real stats geek and can happily bury my head in an Excel spreadsheet for most of the day. So much so that when planning a holiday I'll crack open a spreadsheet for some reason or another; my wife often complains that I then manage to turn something that should be really exciting into something exceptionally boring!
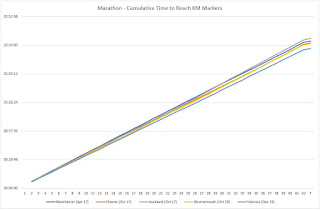


Chart 6 - Heart Rate, 5k Rolling Average
 Similar to earlier graphs I've tried to remove the anomalies at individual KM markers that could be caused by casual factors such as a hill or erroneous data.
What does it tell me? - The output makes it clearer that I was doomed at the outset at Auckland. Going forward I need to take a look at my HR early on and adjust if it starts to sustain more than 155 early on in the race. Somewhat bizarrely at Chester my HR went down at the same time my pace increased at that stage of the race - I'm struggling to explain that one other than remembering at the time I felt sluggish up to that point before experiencing a second wind.
It is no surprise that my HR goes up towards the end of the race due to a combination of accumulated fatigue but also finishing at maximum effort. Even so, my HR struggles to go much above 170.

When it comes to running, the opportunities for analysing performance are almost endless, more so now that we can readily access GPS watches that hold all sorts of data. Nonetheless I often find the analysis on Strava really interesting, but at the same time I'm always craving more. In my work life I often tell others that the easy bit is to provide data, but how can you convert that data into intelligence?
I therefore set out to look back at the five marathons I've run and see whether there is a way to determine something a bit more meaningful. This is quite a long read and you may get bored by the end of it if you don't share my enthusiasm for stats! The chances are that much (all?) of this sort of stuff has probably been analysed to death before and if so its just chance before I get accused of plagiarism!
To date I have run the following 5 marathons:
Manchester - April 2017 (2.27.59)
Chester - October 2017 (2.26.11)
Auckland - November 2017 (2.31.11)
Bournemouth - October 2019 (2.25.48)
Valencia - December 2019 (2.20.48)
Before looking at the various outputs it goes without saying no two races are the same. For instance:
- Race conditions on the day are different - temperature, inclines, wind, total distance slightly different etc.
- Race situation - Different parts of the race may require different tactics in response to how the race evolves. Sometimes you will be working with others which makes it easier.
- How you feel on the day, sometimes you are just simply a bit more 'up for it'.
All of this makes a direct comparison difficult and some of this you will see in the following charts (click to enlarge)...
Chart 1 - Cumulative Time at Each KM

This chart shows how long it took cumulatively to reach each km marker. Very simple to produce but equally the least informative - as the times between my best and worst marathon result are less than 11 minutes.
As a piece of analysis its as good as useless, you can barely discern from the chart that my best time was at Valencia, let alone where the time was gained compared to earlier efforts.
What does it tell me - not a lot!
Chart 2 - KM Pace - 5km Rolling Average

Showing my pace as each km rolls by will be so jumpy the output would be as good as impossible to discern any real trends. For instance, if there is a hill you are bound to experience a very slow km. The output would therefore be more reflective of the on the day race conditions/course.
I therefore decided to produce a 5km rolling average ie. at 5km on the graph shows my average pace per km between KM 1-5. At 6km it shows my average km pace between KM 2-6 etc. The output is therefore a bit smoother and is more reflective of my actual effort at that stage of the race, rather than just over a single KM where are many other variables.
What does it tell me - Whilst Manchester was overall one of my slower times, it was probably my smoothest effort, closely followed by Valencia albeit the latter was at a faster pace throughout. Auckland demonstrated I probably went too hard at the outset, especially since it was only 3 weeks post Chester and it was clear I hadn't recovered enough and I paid for it, albeit I managed to find some pace towards the end. Bournemouth was a a bit all over the place and reflects just how windy it was on the day, where there were some sections running with the wind, following by sections in the opposite direction. Chester shows that I had a really strong 3rd quarter and although I have no doubt this is what won me the race, I started to hang on towards the end and just couldn't hold onto the pace.
Chart 3 - KM Pace - 10km Rolling Average

Exactly the same output as the second chart but the rolling average is over 10km. It further softens any differences in pace caused by course characteristics.
What does it tell me? - Apart from the obvious - Valencia was my fastest marathon and Auckland my slowest, it shows that in three of my marathon efforts (Manchester, Chester and Valencia) my fastest part of the race was the third quarter, but my pace tends to fall off a bit in the last 10k - perhaps I'm putting in too much effort too soon?
Chart 4 - Accumulated Time Difference based on 3.30min/km

The idea with this chart is that it shows my relative pace during a race compared to 3.30min/km, which is as it happens is my overall average pace at my first marathon at Manchester. As an example, if I ran my first km in 3.25, this would be -5. If I ran the next km in 3.25 again, it would now be -10. If followed by a slower km in 3.32, the accumulated difference is now -8. Therefore the steeper the downward line is, the more time I'm banking, but if the downward line shallows off then my pace is starting to slow down. Any upward trend means that I'm actually running slower than my my marathon average at Manchester.
What does it tell me? - My Valencia pace was quicker at the outset and stayed that way. However, whilst early on I was quick at Bournemouth my pace started to slow down and if anything I started to run slower towards the end. In contrast, Chester was slower at the outset, had a storming 3rd quarter, followed by my pace drifting slightly in much the same way it did at Bournemouth.
Chart 5 - Heart Rate at Each KM Marker

Rather than pure pace this chart tracks what my heart rate was at each KM marker. Its a bit messy - for instance around half way at Bournemouth there was a steep hill that caused a HR spike.
What does it tell me? - I think this chart, when looking in conjunction with the others is far more informative than it first appears. It tells me that actually with Auckland I was in trouble at the outset, just that I didn't know it. I was running too fast, resulting in a higher HR and ending up having to slow down considerably. Interestingly, my HR at Valencia is only slightly lower than at my other races - it tells me that I was clearly fitter so able to sustain a faster pace albeit at a similar heart rate. It also tells me that my HR max is quite low (something I've noticed during training - about 172 is about as high as it gets). Overall, this graph tells me a lot about my operating window and anything much above 160, when looked at in conjunction with earlier graphs shows my pace starts to fall off a bit.
Chart 6 - Heart Rate, 5k Rolling Average

What does it tell me? - The output makes it clearer that I was doomed at the outset at Auckland. Going forward I need to take a look at my HR early on and adjust if it starts to sustain more than 155 early on in the race. Somewhat bizarrely at Chester my HR went down at the same time my pace increased at that stage of the race - I'm struggling to explain that one other than remembering at the time I felt sluggish up to that point before experiencing a second wind.
It is no surprise that my HR goes up towards the end of the race due to a combination of accumulated fatigue but also finishing at maximum effort. Even so, my HR struggles to go much above 170.
Chart 7 - Beats per mile

This is something that I was introduced to from reading another blog. It sounds a bit mad at first but it does make sense albeit I've taken the analysis a step further. It combines your pace and heart rate so is a proxy to measure running efficiency. Its a bit like mpg in a car - the size of the fuel tank does not dictate how far you can go, and an economical engine is great but it wont get you far without much fuel.
For example 3.30min/km = 3.5 * 1.609 = 5.63mins per km * HR of 150 = 844 beats per mile. It is a good overall measure of aerobic fitness - the less beats it takes your heart to complete the mile, the greater your aerobic fitness is. It doesn't necessarily mean you will run faster as there are other factors at play (e.g. running economy), but it gives you a good idea whether or not your fitness is heading in the right direction.
For example 3.30min/km = 3.5 * 1.609 = 5.63mins per km * HR of 150 = 844 beats per mile. It is a good overall measure of aerobic fitness - the less beats it takes your heart to complete the mile, the greater your aerobic fitness is. It doesn't necessarily mean you will run faster as there are other factors at play (e.g. running economy), but it gives you a good idea whether or not your fitness is heading in the right direction.
What does it tell me? - Whilst not surprising that it takes more beats per mile during the latter part of the race due to accumulated fatigue, it shows that I was clearly much fitter in Valencia. With the exception of Auckland my relative fitness were all pretty similar - no surprise as these three marathons resulted in 2.25.48, 2.26.11 and 2.27.59. Therefore if my BPM in similar training runs are similar or better than Valencia going forward then it means I'm in pretty good nick.
Chart 8 - Heart Beats to Complete the Marathon
 A bit of an odd one this. I thought it interesting to see how many heart beats it takes to run a marathon. The analysis took a bit of jiggery pokery to calculate but is near enough right. I wasn't sure what, if anything the data was going to tell me.
What does it tell me? - I was pretty amazed to see that Manchester, Chester and Bournemouth all took almost exactly the same number of heart beats - less than 50 between the three races! It clearly shows that for whatever reason Auckland was an off day, too hard too soon maybe, lack of recovery from Chester 3 weeks early, accumulated fatigue during the holiday, perhaps the early onset of a cold that I came down with a couple of days later all probably playing a part. Valencia is a difficult one - less beats, but this simply seems that it is down to running the race 5 minutes quicker and not actually down to a lower HR average. Again, it points to being fitter and being able to sustain a quicker pace at a similar HR average.
Chart 9 - Relationship Between Time and Total Beats
 I thought I would take a previous chart a step further and see whether there was a relationship between HR and Marathon finishing time. The orange is my total heart beats (left axis) whilst the bit of blue is what I'm labelling as 'Excess time' (right axis).
What does it tell me? - I'm pretty astounded by the output - there is a clear relationship between my end marathon time and the number of heart beats - almost a perfect correlation. In the case of Valencia and Auckland the correlation is in fact perfect.
It again points to that actually being fitter isn't necessarily resulting in a lower HR during a race (i.e. less beats is simply just a by product of finishing the race sooner). Why would it, as you are running at maximum effort. But what it also shows is that my running economy is improving i.e. akin to the car analogy my mpg is improving, each heart beat can carry me a bit further than before.
In three of my races the 'Excess time' suggests I ran a touch slower than my accumulated heart beats. It could simply be down to on the day casual factors as the difference is one the whole, pretty minimal.
Chart 10 - Finishing Time Prediction
 This looks at my previous 5km in the race and assumes that if I continued that pace until the finish what my finishing time would be. For instance if I'm at the 10km marker and have taken 35 minutes to get there, but the last 5km took 18 minutes (3.36min/km), it assumes I will run at 3.36min/km over the remaining 32km. Obviously in the early part of the race it can be subject to some wild movements due to the distance remaining, likewise with only a few km remaining it is unlikely there will be much movement unless your pace starts to rapidly fall away.
I think in principle this works in the same way as the 'Training' function on my Garmin watch where it predicts how long it will take to complete the workout.
What does it tell me? - Manchester was good evidence of a controlled race resulting in a negative split. At Valencia I went out faster and whilst at one point it was suggesting a sub 2.20 was starting to become feasible it gradually drifted out of sight, but not excessively so. It definitely backs up my theory that had I been able to do a few longer runs a sub 2.20 remains feasible.
Bournemouth is a funny one - the wind on the day was so strong with long sections of running with and against the wind, you can actually see it in the chart. Chester shows where my race started to come alive, but ran out of legs towards the end of the race, but at that point I was on my own, the course got a bit hillier and the race was already won.
Overall - I'm no sports scientist so am probably missing all sorts of insight. For me there are a few key pointers to take away:

What does it tell me? - I was pretty amazed to see that Manchester, Chester and Bournemouth all took almost exactly the same number of heart beats - less than 50 between the three races! It clearly shows that for whatever reason Auckland was an off day, too hard too soon maybe, lack of recovery from Chester 3 weeks early, accumulated fatigue during the holiday, perhaps the early onset of a cold that I came down with a couple of days later all probably playing a part. Valencia is a difficult one - less beats, but this simply seems that it is down to running the race 5 minutes quicker and not actually down to a lower HR average. Again, it points to being fitter and being able to sustain a quicker pace at a similar HR average.
Chart 9 - Relationship Between Time and Total Beats

What does it tell me? - I'm pretty astounded by the output - there is a clear relationship between my end marathon time and the number of heart beats - almost a perfect correlation. In the case of Valencia and Auckland the correlation is in fact perfect.
It again points to that actually being fitter isn't necessarily resulting in a lower HR during a race (i.e. less beats is simply just a by product of finishing the race sooner). Why would it, as you are running at maximum effort. But what it also shows is that my running economy is improving i.e. akin to the car analogy my mpg is improving, each heart beat can carry me a bit further than before.
In three of my races the 'Excess time' suggests I ran a touch slower than my accumulated heart beats. It could simply be down to on the day casual factors as the difference is one the whole, pretty minimal.
Chart 10 - Finishing Time Prediction

I think in principle this works in the same way as the 'Training' function on my Garmin watch where it predicts how long it will take to complete the workout.
What does it tell me? - Manchester was good evidence of a controlled race resulting in a negative split. At Valencia I went out faster and whilst at one point it was suggesting a sub 2.20 was starting to become feasible it gradually drifted out of sight, but not excessively so. It definitely backs up my theory that had I been able to do a few longer runs a sub 2.20 remains feasible.
Bournemouth is a funny one - the wind on the day was so strong with long sections of running with and against the wind, you can actually see it in the chart. Chester shows where my race started to come alive, but ran out of legs towards the end of the race, but at that point I was on my own, the course got a bit hillier and the race was already won.
Overall - I'm no sports scientist so am probably missing all sorts of insight. For me there are a few key pointers to take away:
- My HR is really important, particularly at the early stage of the race. It is not something I have ever really actively monitored before.
- With the odd exception my pace is drifting at the end of the races more than I realised. I knew there was some drift and it is almost certainly connected to the strongest part of my race which is usually the 3rd quarter. It gives me something to ponder, whether I should hold back slightly to try and remove the drift, or actually this drift is just a characteristic of my race craft and is going to happen anyway i.e. holding back in the 3rd quarter will actually just result in a slower race.
- More longer runs. I suspect some of the drift is lack of weekly longer runs caused by injuries. I also probably need to think about some mini efforts towards the end of the longer runs.
If you have got this far, then congratulations and hope you found it reasonably interesting!


Comments
Post a Comment